
For the past two weeks, we’ve been pouring over the data of this year’s industry survey and I’m very excited to finally share the results of the 2021 Surface Design Industry Survey with you!
And while we were far off from meeting our participant goal for 2021 (which we knew was ridiculously lofty), we’re still incredibly grateful for the generosity of the 334 designers who shared the intimate details of their businesses with us.
Overall, I’m incredibly optimistic about the state of our industry after analyzing this year’s data and I hope you will be too once you read through the results below.
And if you’re new here, it might help if you head to last year’s survey results post to understand what I share below and for a bit of background on why surveys like this are so important to our industry.
Ok, let’s get started with the 2021 Surface Design Industry Survey results:
Demographics
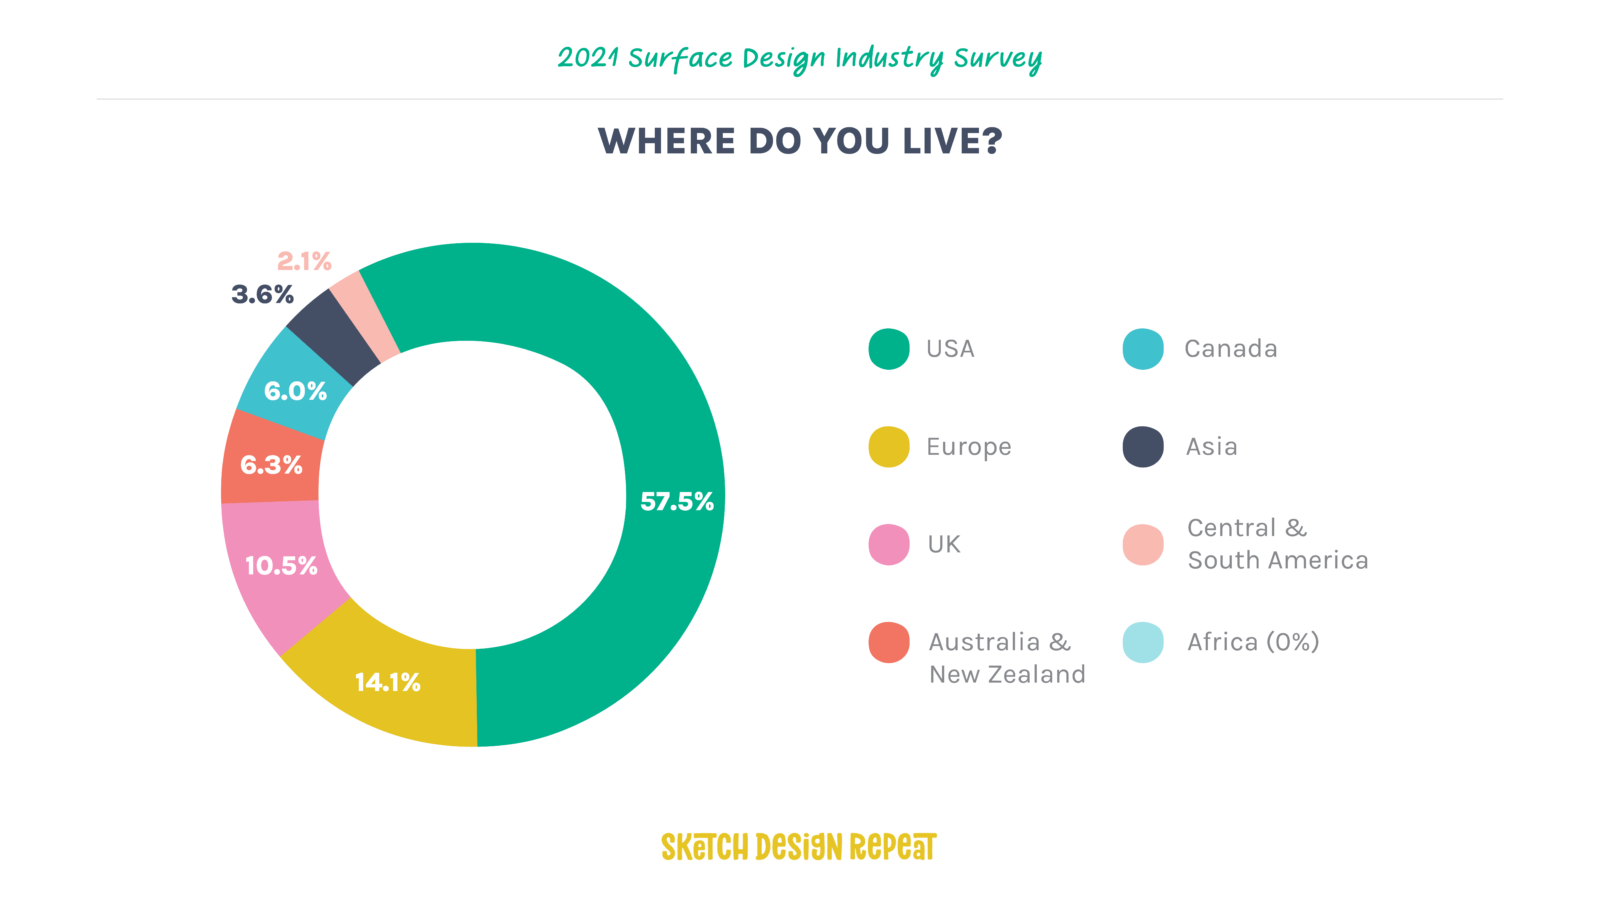
This year, we had participants from a total of 36 countries represented, slightly down from 2020 (38 countries). And just like the previous year, we saw that more than half of the participants were from the US, but we also saw some new countries represented like Sweden, Kuwait, Hong Kong, Bulgaria, and Argentina.
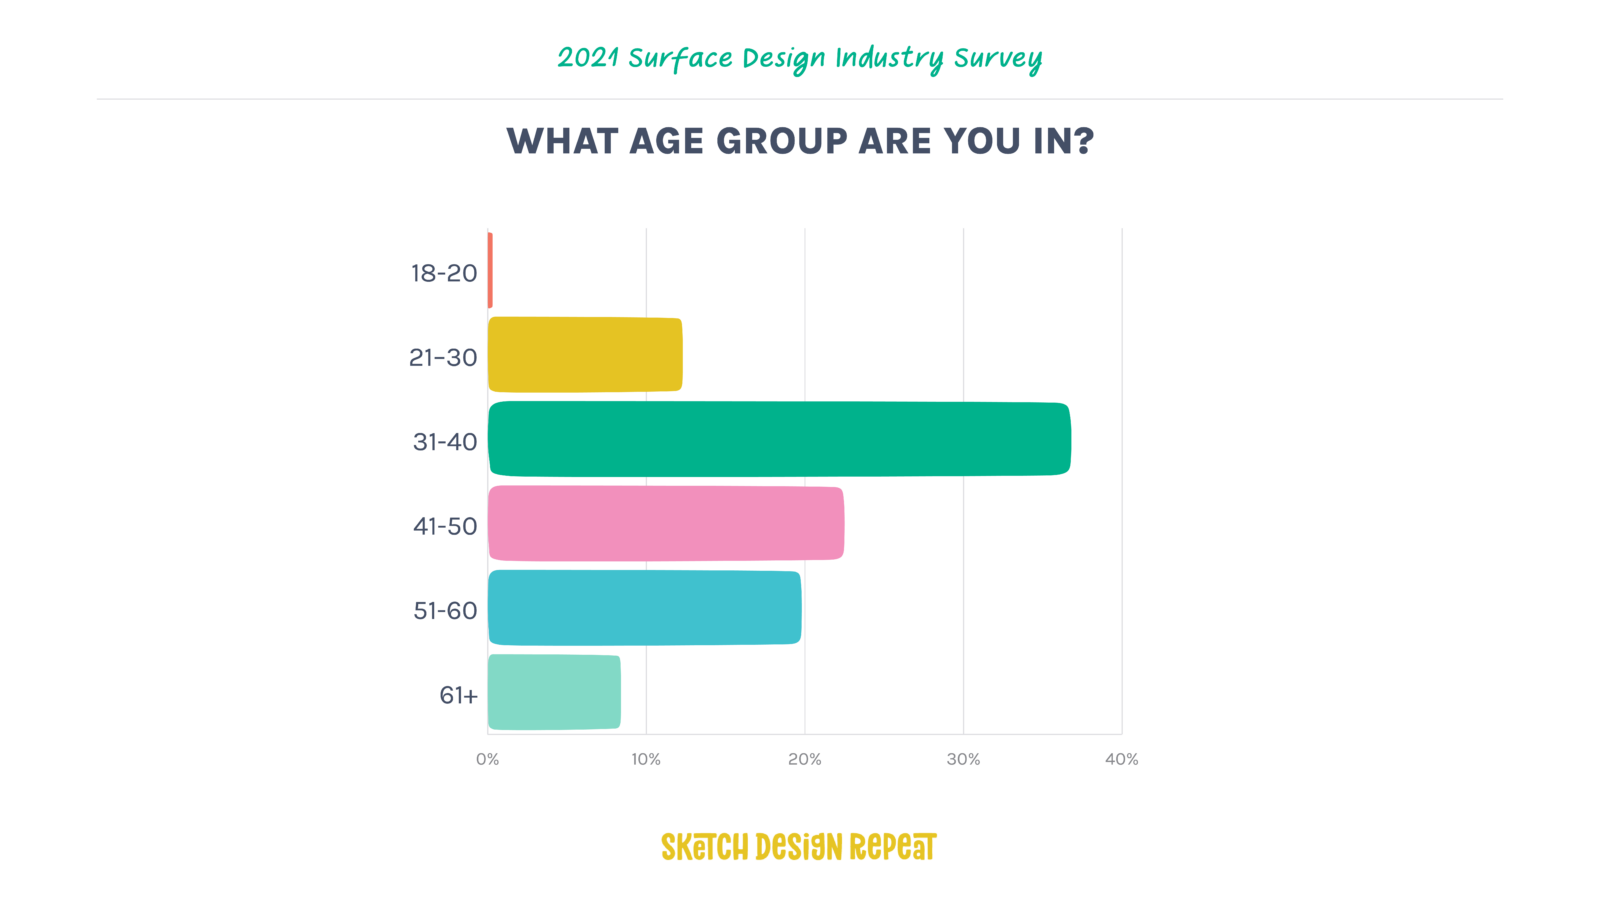
The average age in 2021 was still 42, the same as 2020. And while there was only a single artist in the 18-20 age group, all other groups were well represented.
One large difference between 2021 and 2020’s numbers was an increase in those aged 50+.
In 2020, 22.8% of participants were over 50 years old, but in 2021 that number has grown to 28.1%. So never assume your age is a barrier to becoming a surface designer!
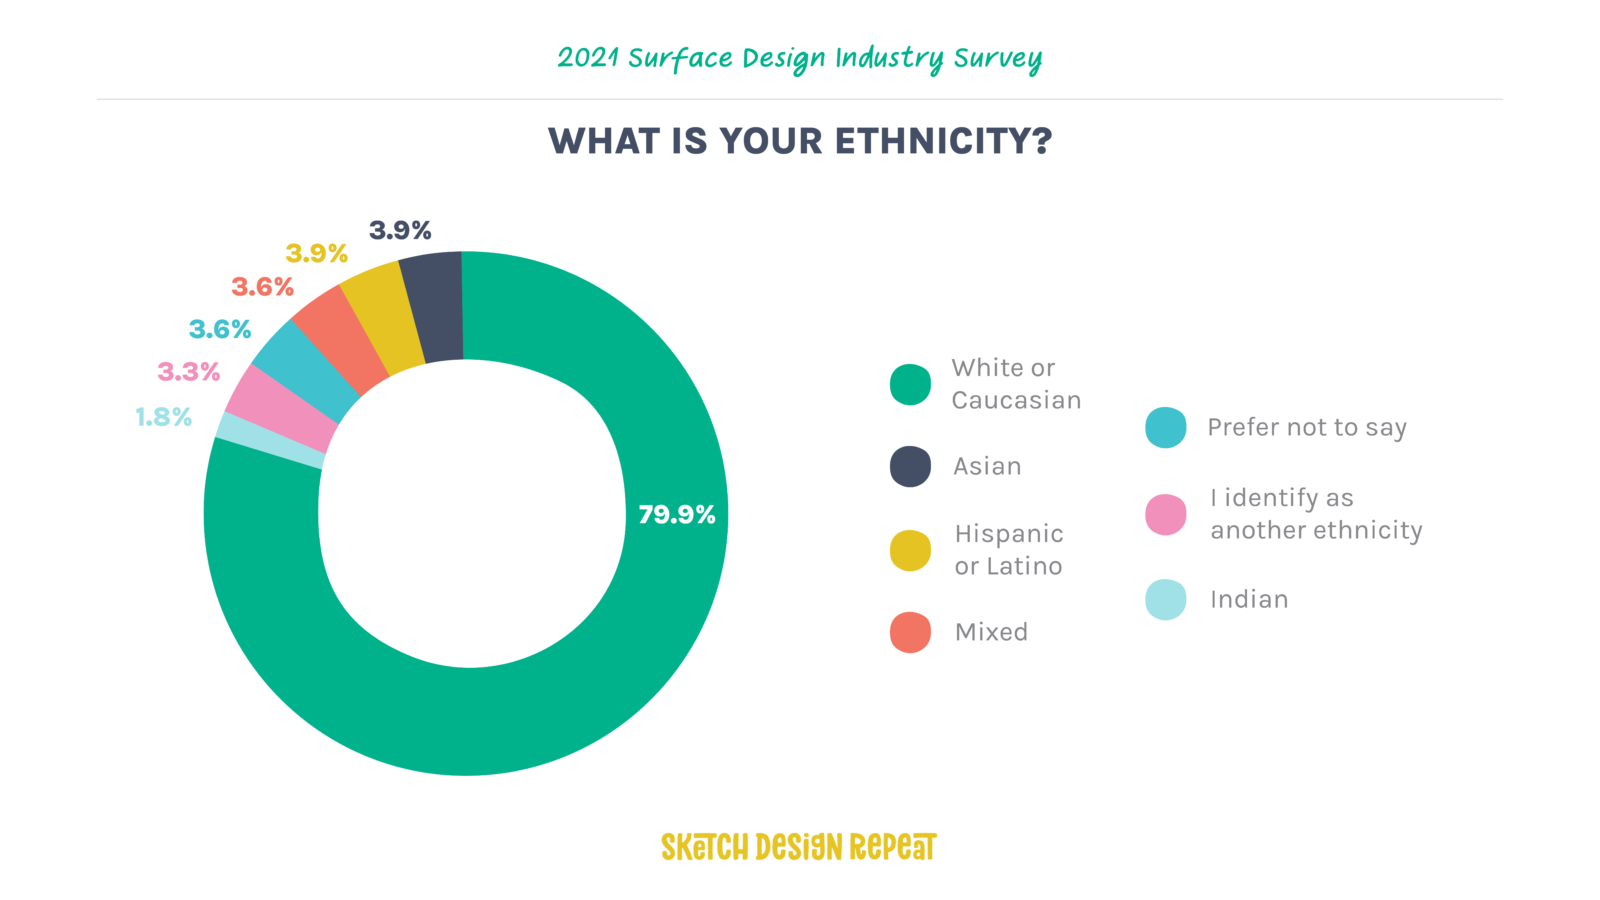
We also asked about ethnicity, gender, and sexual orientation again in this year’s survey in an effort to advocate for those who are underrepresented because we believe in celebrating our differences and encouraging everyone in the industry to thrive as artists, no matter who you are.
Still, several portions of the population (men, the LGBTQ+ community, and non-caucasian/white artists) are still severely underrepresented in our industry.
Work Experience
The length of time that participants have been earning income as an artist changed significantly in this year’s survey. In 2021, new designers made up only 39.6% of survey participants, compared to 56.2% in 2020 while veteran designers represented 40.1% of participants this year, almost double the percentage from 2020 (22.2%).
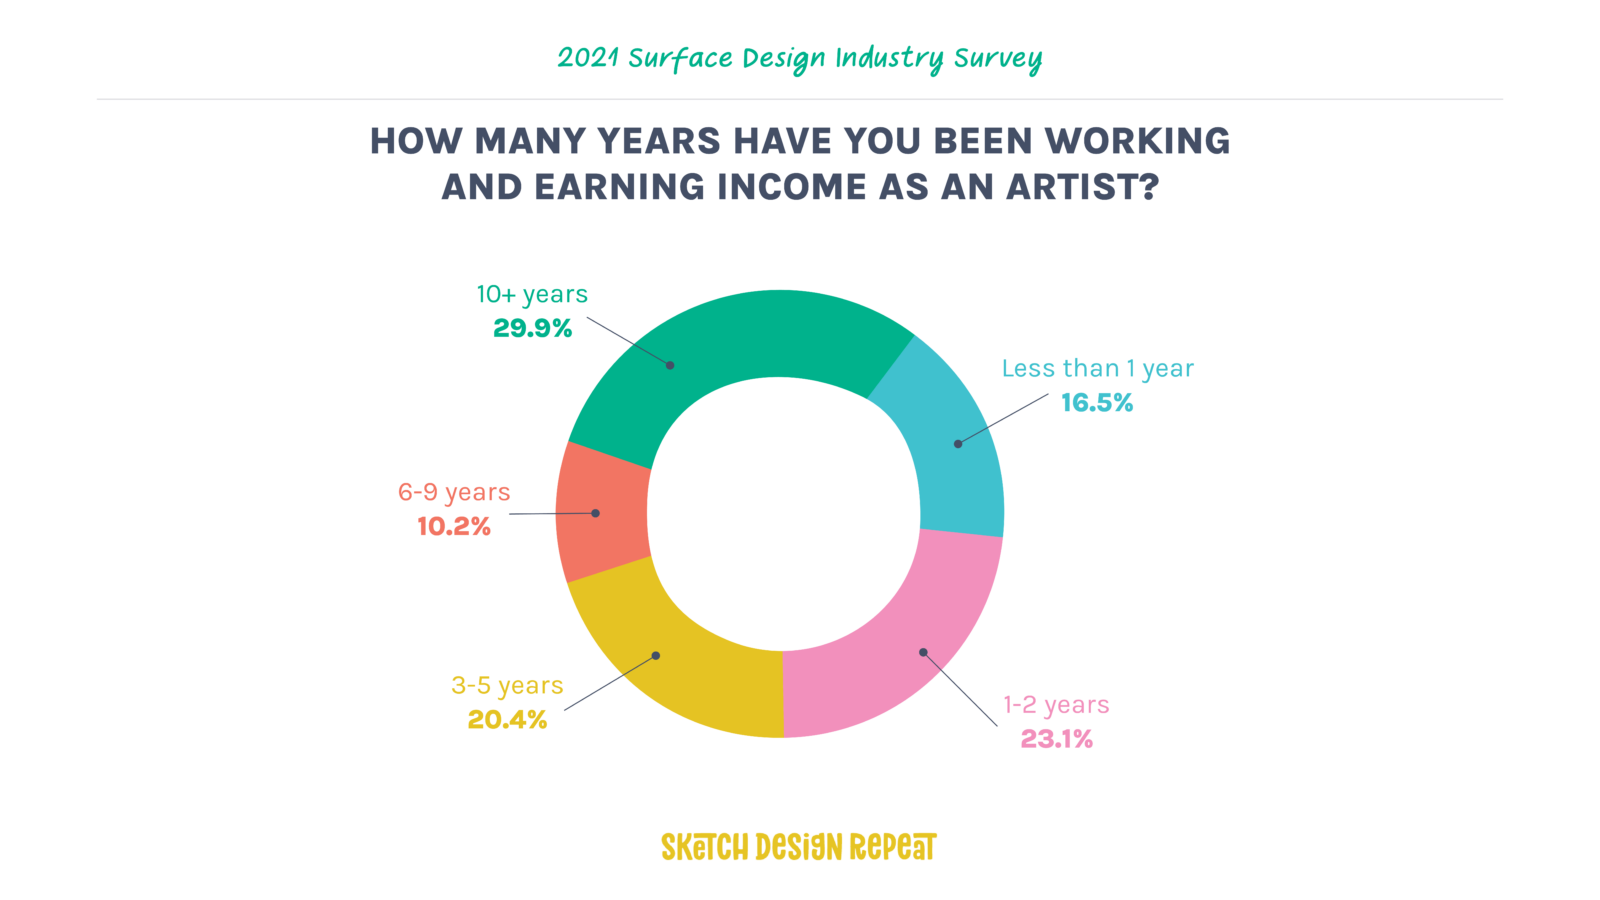
These results of this question are definitely a very positive indicator that it’s still possible to be in the surface design industry long term.
Work situation also saw a very different result in 2021.
In 2020’s survey, we saw a nearly 3-way split between answers. However, his year, the majority of participants were either Full or Part-time artists, while only 12.9% considered themselves hobbyists.
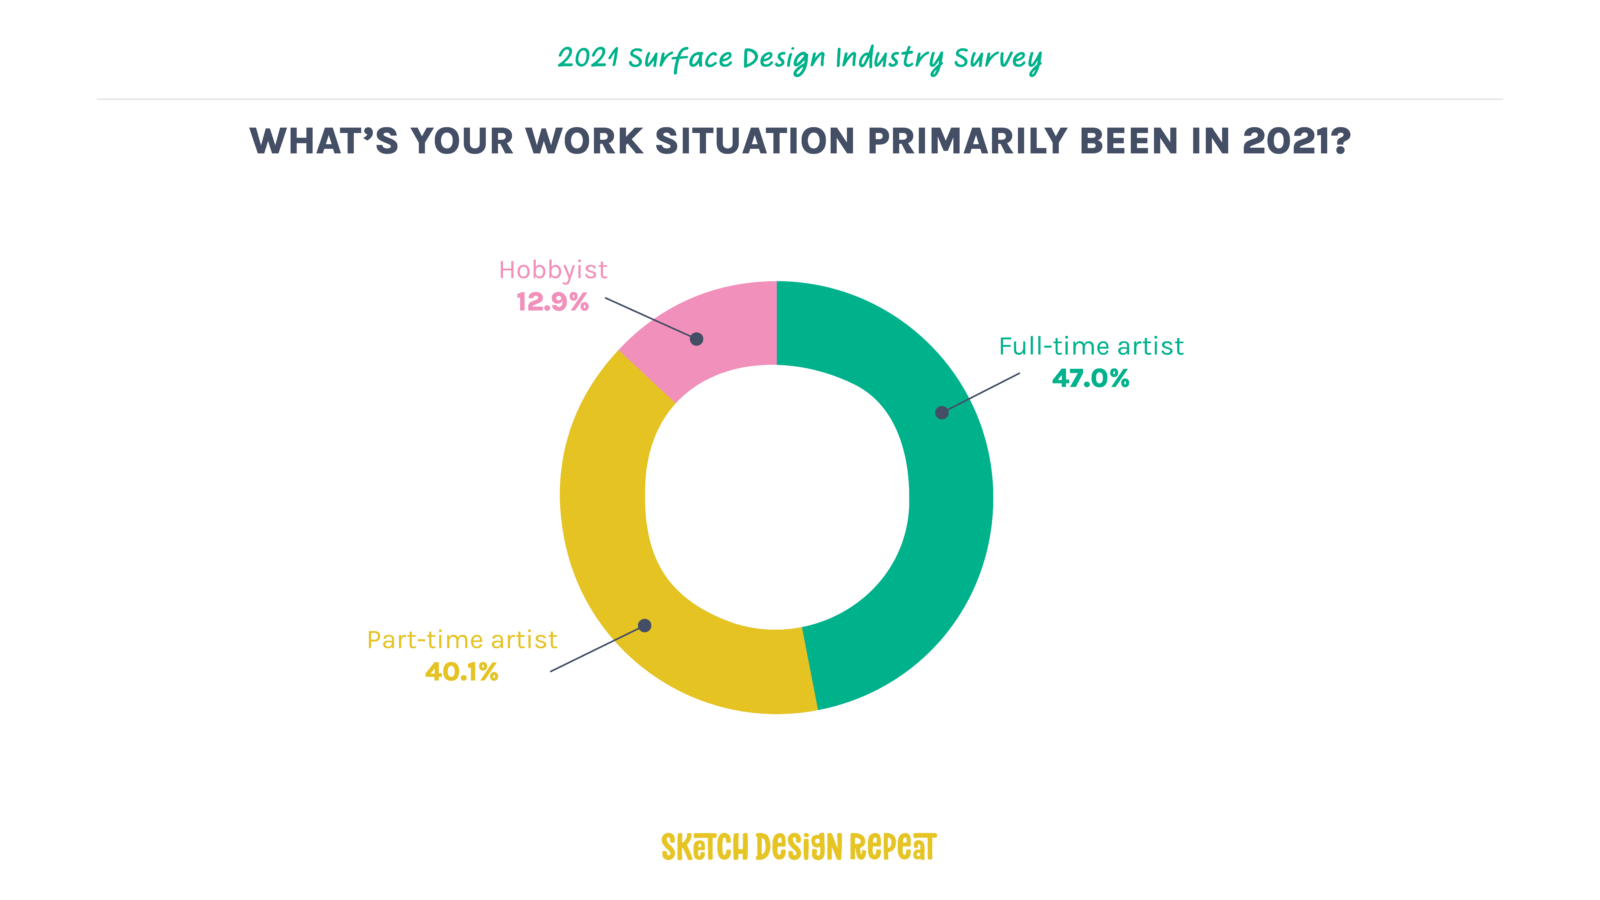
Notes About Hobbyists: 80.8% of all hobbyists we surveyed this year eventually planned on becoming full-time artists, confirming our assumption from 2020.
Also, all the income data shared below is blended – it accounts for all respondents, including hobbyists. This means that income and pricing skew slightly lower than if only full and part-time designer data was used.
Income
The majority of our survey focuses on the income and pricing amongst designers in 2021 and fortunately, we saw an increase in most numbers compared to 2020 – this bodes very well for the surface design industry overall!
Total Yearly Income
As you can see from the graphic below, the most common total income was less than $1,000 (20.4%) while the average income ranged from $20,600-$34,600 – roughly a 13% increase over 2020.
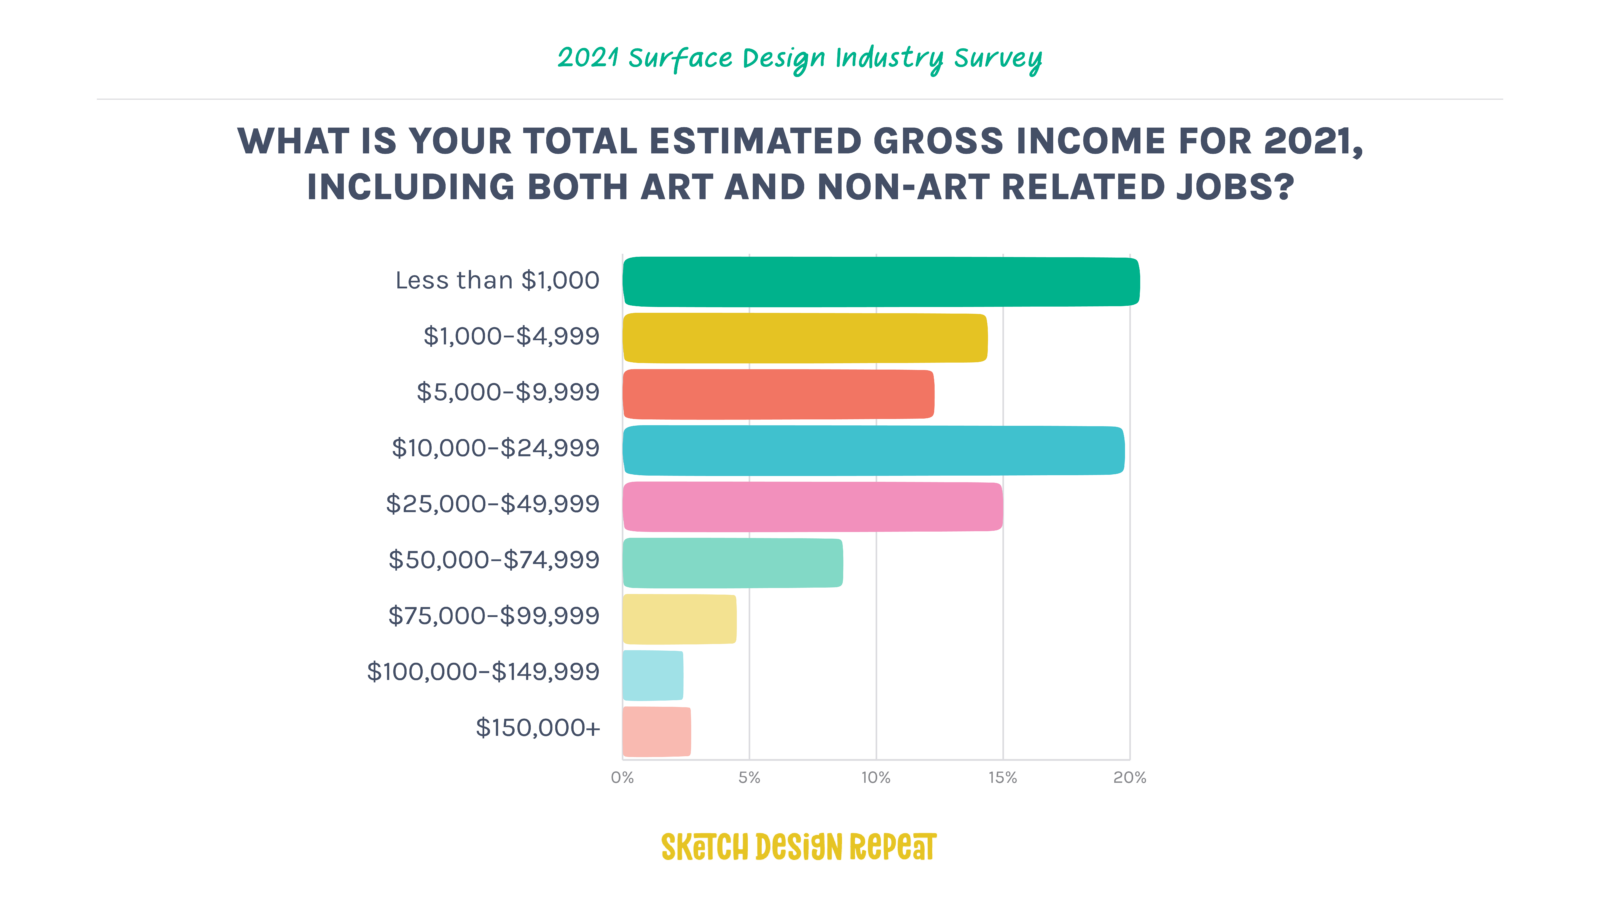
And if we look at just those who were full-time designers or veterans (those with 6+ years of experience), the average income was much higher. If you’d like to see the exact ranges for all brackets of experience, you can find that in our detailed 30+ page survey report.
Change in Income
Since this is the second year of the survey, we were able to ask how participants’ income had changed compared to last year and while nearly one-third said it decreased, roughly half of the participants said their income increased in 2021.
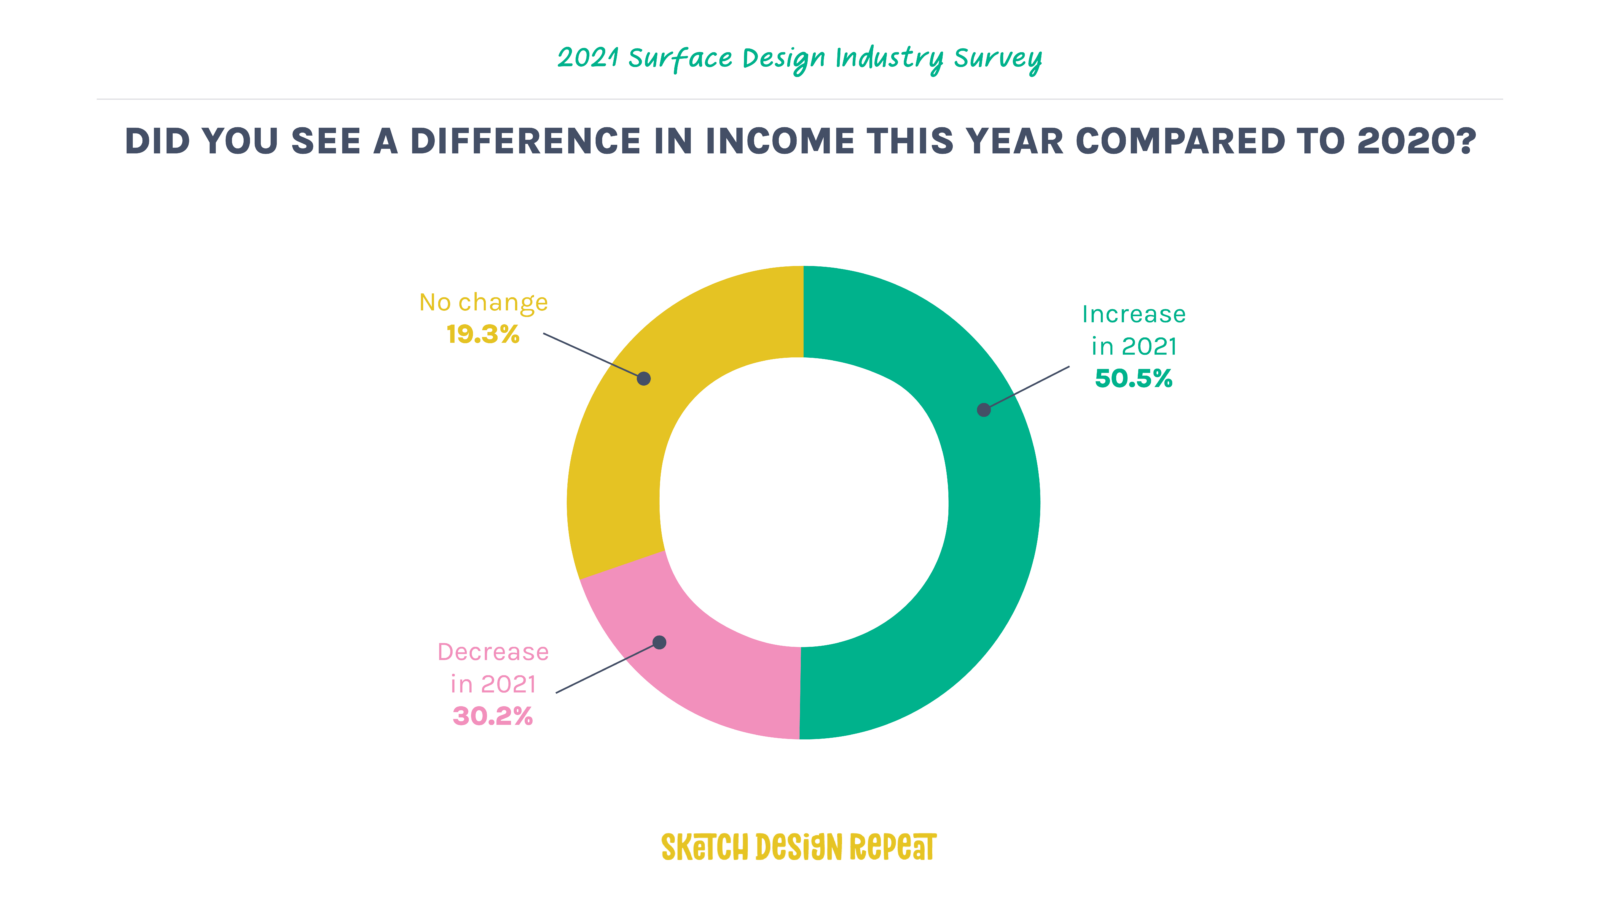
Overall, this result is very encouraging and it will be interesting to see how the results change over the next few years.
Streams of Incomes
Because of the variability of income sources available to us as designers, we changed how we asked about streams of income this year. Unlike 2020’s survey where we singled out surface design with separate questions, this year we grouped all income streams together.
Participants were able to choose multiple income streams and the top 3 answers were: Print on Demand, selling physical products, and licensing.
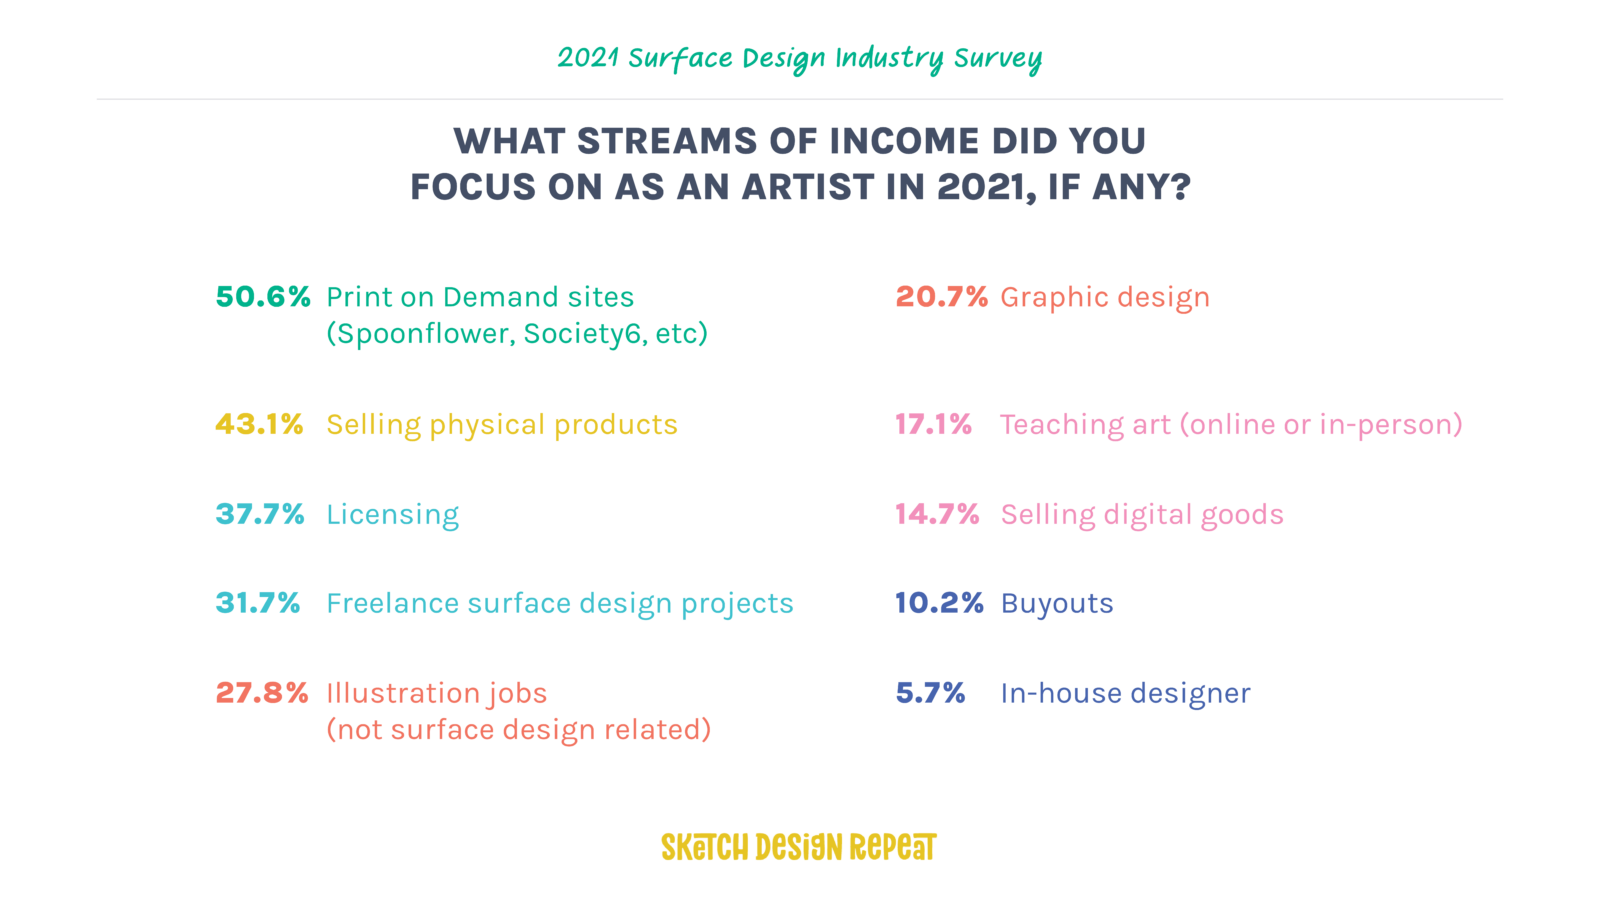
The average number of streams of income was 2.8 which illustrates that most artists have multiple streams of income at the same time, something we encourage here at Sketch Design Repeat (as long as you do it strategically).
And if you’d like to see the average income for licensing, Print on Demand, selling physical products, and more, you’ll find them all inside our detailed 30+ page survey report.
Covid’s Continued Effect on Designers in 2021
With the pandemic still affecting daily life for the second year, we wanted to ask if Covid continued to have an effect in 2021 and it was a near 50/50 split on whether participants felt like it continued to affect their business. Hopefully, 2022 will be kind to us all!
And just like in 2020, we asked an open-ended question to invite participants who did feel that the pandemic affected their business to share their thoughts with us. We saw a wide variety of responses, but there were several recurring themes among participants:
Designers saw a lack of in-person events in 2021 whether it was teachers, fine artists, those selling physical products or artists seeking trade shows/fairs.
Many saw an increase in Print on Demand sales, although due to the small commission rates, POD income stayed very low overall.
Some had more free time to create artwork while some, due to job loss or other circumstances, had less time.
Those who created physical products or needed lots of supplies often dealt with slow shipping and multiple supply chain issues.
Several had clients who went out of business or decreased the number of products, art purchased, or projects commissioned.
One additional note was that there was a bit more positivity and optimism in the responses this year.
Even if participants led with what negatively affected their business, several then pivoted, shared how they adjusted during the year, and ended on a positive note.


Wow what a great resource! Thank you for sharing it.
Thank you so much for doing this. It’s a very interesting read!